Project Description
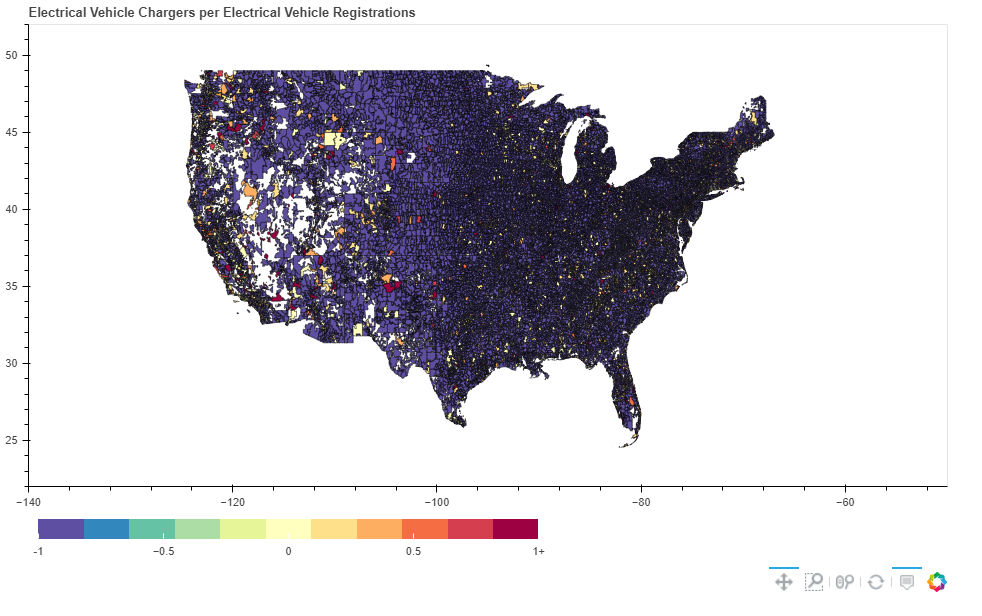
Electric vehicles (EVs) offer great potential to reduce local air pollution and greenhouse gas emissions and reduce oil use by the transportation sector . Local governments and businesses need better tools to understand electric vehicle (EV) demand in their area to determine the placement of charging stations. Specifically, a geospatial view of the EV demand and current supply can help strategize. Our project identifies the geographic areas where the ratio of available public charging stations to registered EVs is the least, most in need of additional charging infrastructure. Given the actual or estimated number of EVs and the actual number of public charging stations in a US zip code, we segment the zip codes in a state and calculate the ratio of public charging stations to vehicles to find areas with more public charging capacity is needed. We visualize the results as a choropleth state map of zip codes with five color gradations.
Proposed Method
We first find clusters of labeled zip codes with similar predictors, then assign unlabeled zip codes to the cluster with the closest match of predictors. Finally, we create a regression model from the labeled data to estimate the number of EV registrations in the unlabeled zip codes within each cluster.
Data Sources
For this project, several data sources were combined using zip code as the primary key. Data availability had us using data for 2016 to provide uniform measures for comparisons. The American Community Survey (ACS) data by the U.S. Census Bureau was the primary demographic and economic data source. The location of EV charging stations was extracted from the U.S. Department of Energy dataset. We can gather EV registration data for some states through Atlas EV HUB. Some states report EV registration by county rather than zip code, which we transformed using a cross-reference table from https://www.kaggle.com/datasets/danofer/zipcodes-county-fips-crosswalk, which leverages US HUD and Census Bureau data sources. After combining and wrangling the data, we had a data file with over 39,000 rows (zip codes) and close to 550 features. All data was publicly available for download.
Clustering
The following steps below were performed to cluster the data points with known EV registration numbers and then classify the data points with unknown registration numbers:
- Impute missing data for any feature with the median of each column.
- Divide the data set into two. One data set with EV registration numbers and the other without EV registration numbers.
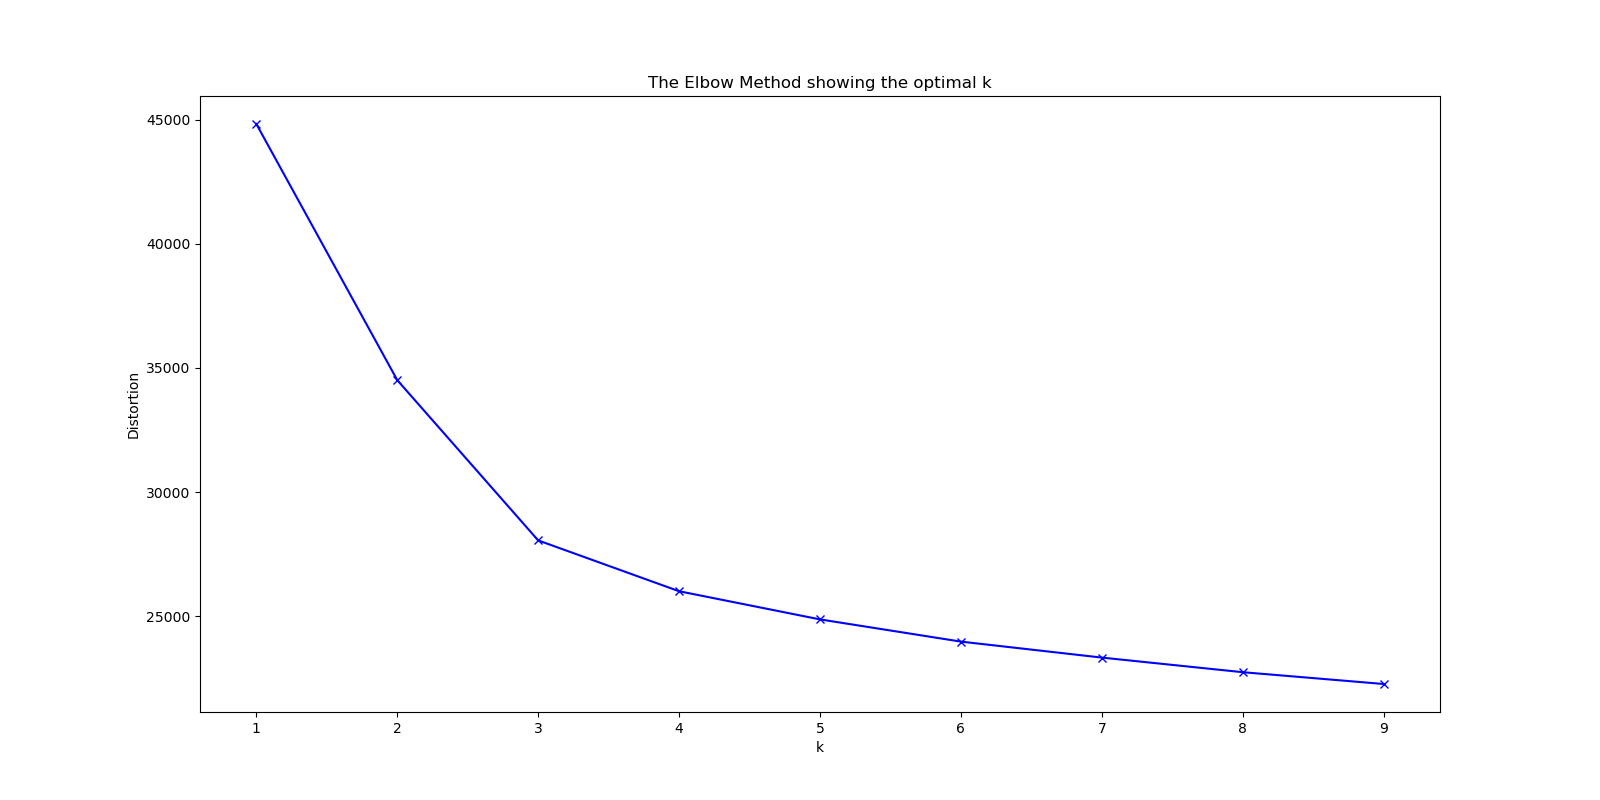
- Run the k-means clustering algorithm on the data set with registration data. Graphing the SSE vs. the number of clusters showed that three clusters capture the most differences.
- Run the k-means clustering algorithm on the data set with registration data. Graphing the SSE vs. the number of clusters showed that three clusters capture the most differences.
- Next, we used the k-nearest neighbor (KNN) classification algorithm to train the dataset from the clustering model’s output by using the new variable as the response variable. The mean accuracy on training data and labels is 98.15%.
- We then used the k-nearest neighbor model to predict the classification of the data points in the data set without EV registration numbers.
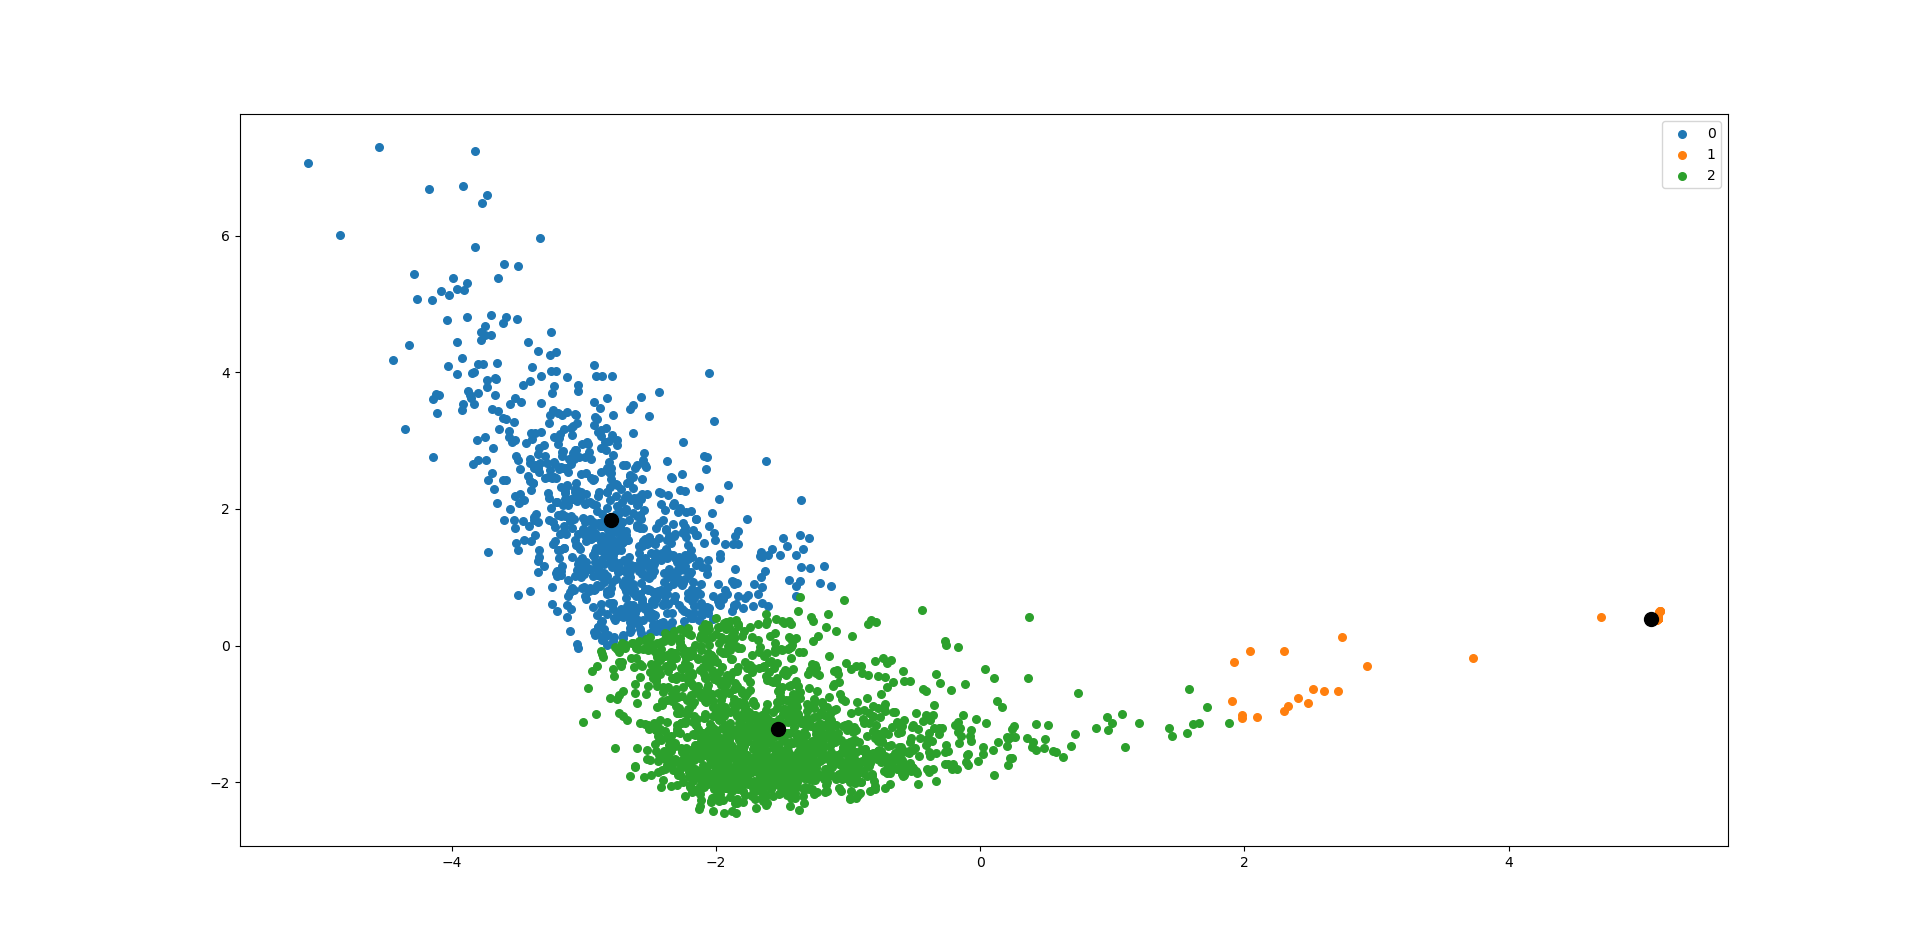
Some cities are classified as 0: Pensacola, FL; Beaumont, CA; Duluth, GA; Bessemer, AL; Norcross, GA; Calabasas, CA. Some cities are classified as 1: Willow Springs, MO; Colony, KS; Hurricane, UT; Oakville, IA; Braselton, GA. Some of the cities classified as 2: Dallas, TX; Los Angeles, CA; Orlando, FL; Minneapolis, MN; Oakland, CA; Jacksonville, FL Some of the similarities among the zip codes in each cluster are education level and population over 25 years old. Most of the cities in cluster 0 are suburbs, and most cities in cluster 2 are urban.
Regression Model
Since we know the actual EV registration for some zip codes, we used this dataset to train a regression model and impute EV registrations for zip codes without this information with predicted values. The steps for building the regression models are outlined below.
- Start with clustered data with registration information available.
- For each cluster (0,1,2), perform features selection to identify the top 10 best scoring predictors using Univariate feature selection.
- Start with over 500 predictors, including granular demographic data (Education, Age, income, transportation type, gender, household characteristics, etc.) and the number of charging stations, gas prices, and electricity rates.
- For each cluster (0,1,2), train a regression model with 70% of the data and test with the remaining 30%.
Visualization
The range of ratios for chargers per registered EV is shown on a map of
the lower 48 states. Each zip code is displayed with a color associated
with a color gradient indicating the ratio of public charging stations
to vehicles. A ratio of -1 indicates no public chargers in the zip code.
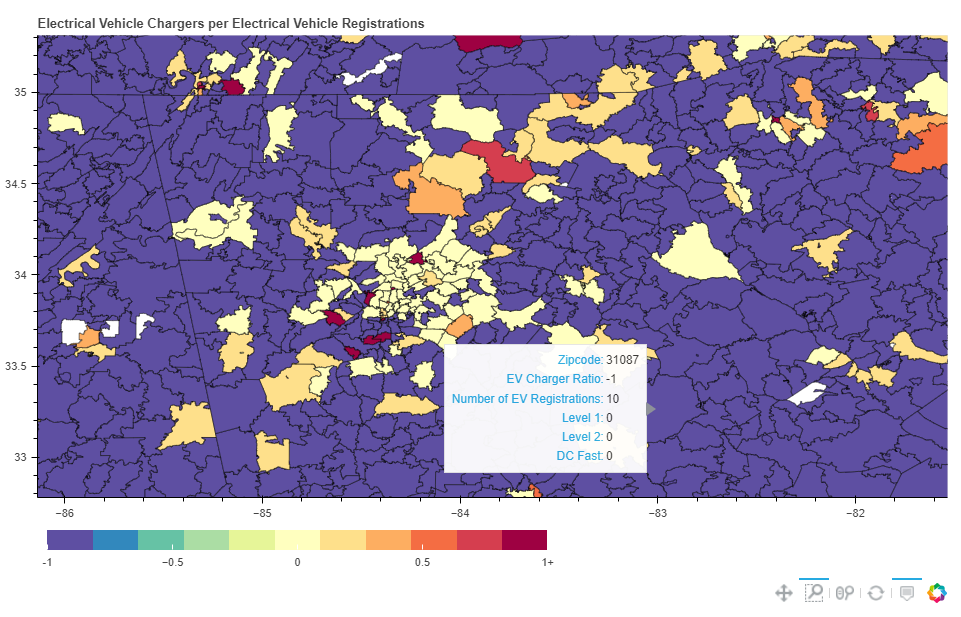
The Python library Bokeh was used to generate a US map to display the
location of electric vehicle charging stations. The map provides box
zoom, wheel zoom, scroll, and reset user commands. Hovering over a zip
code shows a tool tip that displays the zip code, number of EVs
registered, number and type of public charging stations, and the ratio
of public charging stations to registered EVs. Bokeh provided the
display flexibility and features we needed with less programming
complexity than D3.