Project Description
The objective of this project is to test different classification models on their ability to classify whether a car’s gas mileage is above or below the median value of the data set. Gas mileage is measured in miles per gallon (mpg) based on the following car attributes: cylinders, displacement, horsepower, weight, acceleration, model year and origin. This data was retrieved from this website: (https://archive.ics.uci.edu/ml/datasets/Auto+MPG). The data was collected on city-cycle fuel consumption in miles per gallon.
Exploratory Data Analysis
There are 392 observations with 8 variables. Below are the minimum, median, mean, and max of the
variables: cylinders, displacement, horsepower, weight, acceleration, year.
Methods
I split the data into approximately 30% testing data and 70% training data by randomly selecting 30% of the data set for testing and 70% of the data set for training. This is a reasonable split because its standard for most of the data (greater or equal to 70%) to be used for training and the remaining (less than or equal to 30%) for testing.
Results
LDA
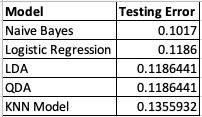
52.19% of the data have mpg value above the median mpg of the data set and 47.81 has an mpg value lower than the median mpg based on the training data set. The testing error for LDA model is 0.1186441.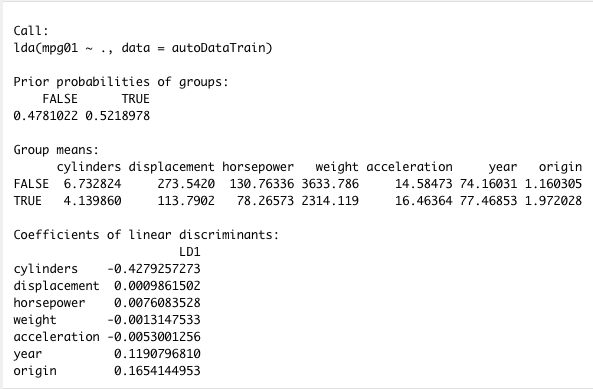
QDA
52.19% of the data have mpg value above the median mpg of the data set and 47.81 has an mpg value lower than the median mpg based on the training data set. The testing error for QDA model is 0.1186441.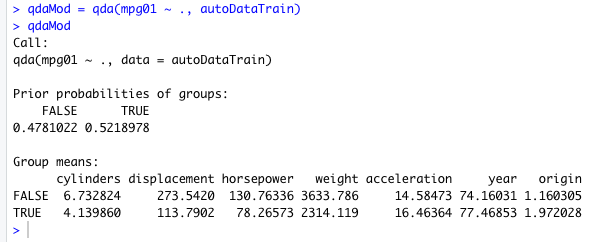
Naive Bayes
57 data points were correctly classified as being less the median mpg of the data set and 49 data points were correctly classified as being greater than the median mpg of the data set.The testing error for the Naive Bayes model is 0.1017.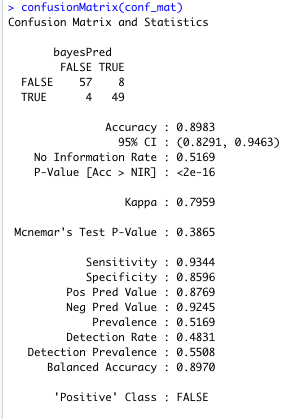
Logistic Regression
54 data points were correctly classified as being less than median mpg of the data set and 50 data points were correctly classified as greater than the median mpg of the data set. The testing error for the logistic regression is 0.1186.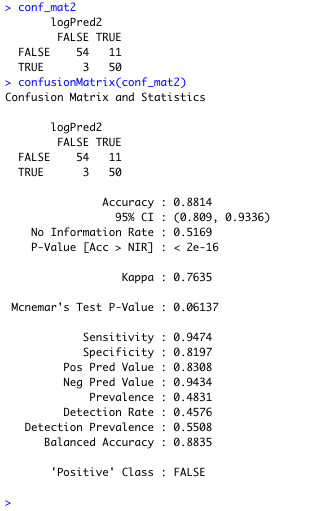
KNN
The k value with the least testing error was k = 4 with a testing error of 0.1355932. 55 data points were correctly classified as being less than the median mpg of the data set and 48 data points were correctly classified as being greater than the median mpg of the data set.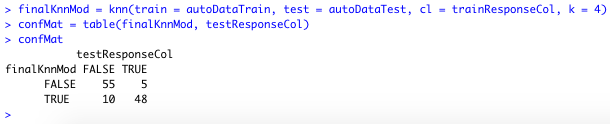
Conclusion
The Naive Bayes model had the least testing error therefore performed the best. Logistic regression performed
second best. KNN performed the worst out of the five models. LDA and QDA had the same testing error.