Project Description
The objective of this project is to use data mining or machine learning methods to predict or approximate the mean and variance of 200 realizations of Y values for some given pairs of (X1, X2). We are given two independent variables X1 and X2 and the response variables for the mean and variance of the 200 realizations. There are 10,000 observations in the data set.
Exploratory Data Analysis
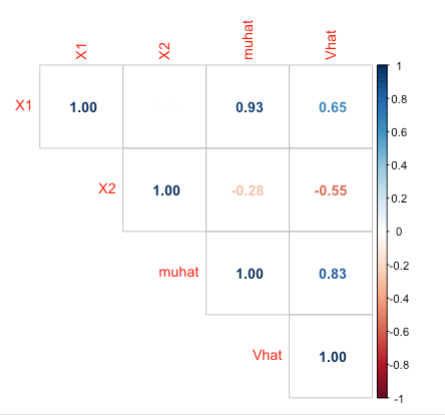
As shown in the correlation plot below, there is no correlation between
the two independent variables X1 and X2. There is also a strong positive
correlation (0.83) between the two response variables muhat (mean) and
Vhat (variance). There is also a strong positive relation between the
independent variable X1 and the response variables muhat (mean) and Vhat
(variance). There is a low to medium degree of negative correlation
between the independent variable X2 and the response variables muhat
(mean) and Vhat (variance).
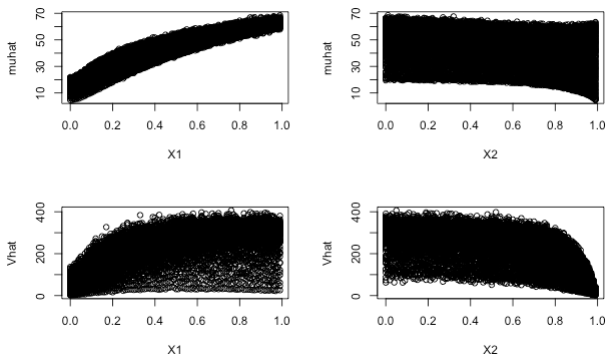
The plot below shows the predictors (x-axis) vs the response variables
(y-axis). As shown in the correlation plots, the plot of X1 and the
response variables (muhat and Vhat) have positive slopes meaning
positive correlation and the plot of X2 and the response variables
(muhat and Vhat) have negative slopes meaning negative correlation.
Methods
I split the data set into three parts: 70% Training, 15% validation, and 15% testing. I trained all the models on the training set for muhat and Vhat and then predicted the models on the validation data set and then calculated the mean square error (MSE) for muhat and Vhat. I then picked the model with the lowest mean squared error. To verify that I picked the right model, I also performed k-fold cross-validation (with k equals to 10) on the training data set for all the models for muhat and Vhat and then calculated the mean squared error for muhat and Vhat. I then picked the model with lowest mean squared error from the cross-validation. My final model selection was based on the cross-validation results. I trained the data on the following models: Linear Regression, Decision Tree, Random Forest, Boosting, and Support Vector Machine (SVM). The boosting algorithm and SVM model have tuning parameters. For the boosting algorithm, I ran the cross-validation function to tune the “n.trees” parameter. For the SVM model, I tuned the “C” parameter by fitting the model to the training data set with C values from 0.1 to 10000 in steps of 10 and then calculated the mean squared error. I then picked the C value with the lowest mean squared error.
Results
From the table below, the support vector machine (SVM) model with the
Gaussian kernel with C = 1000 produced the lowest mean squared error for
muhat (mean). The model for boosting was a close second, followed by
Random Forest, then linear regression. Decision Tree performed the worst
on predicting muhat (mean).

From the table below, boosting algorithm produced the lowest mean
squared error for Vhat (variance). Random Forest performed the second
best followed by SVM, then Decision Tree. Linear regression performed
the worst on predicting Vhat (variance).

Conclusion
Support Vector Machine (SVM) with the Gaussian kernel (C = 1000) performed the best in predicting muhat (mean) and the Boosting algorithm performed the best in prediction Vhat (variance). Random forest performed well on the training data set but did not perform as well on the validation, testing and cross-validation tests. The mean squared error for the mean (muhat) is signicantly larger than the mean squared error for the variance (Vhat).